

When creating custom facial implant designs there are two basic steps, creation of a footprint and determining the various thicknesses of material throughout the implant’s footprint. By comparison the establishment of the the implant’s bony surface area coverage (footprint) is more visually apparent as the location. of the desired external effect usually correlates on a near 1:1 basis to the bone underneath it. But what the thickness of the various parts of the implant should be to create the desired effect is less clear.
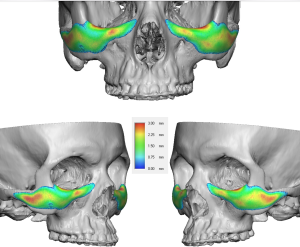
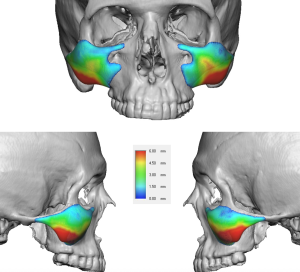
The implant thicknesses can be seen in the design by color mapping which is the way implant designers and surgeons actually think about the implant’s shape in millimeters.
How to read a thickness map
- Warm colors / thicker zones ? where projection or support is greatest
- Cool colors / thinner zones ? feathering and transition areas
- Thickness is measured normal to bone, not skin
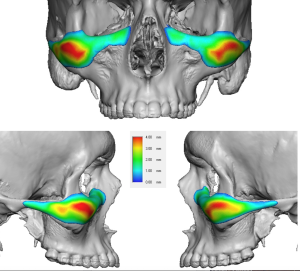
MALE Midface Implant – Thickness Map Rules
1. Peak thickness = lateral zygoma
 Maximum thickness placed laterally, not anteriorly
- Reinforces cheekbone width and strength
 Maximum thickness placed laterally, not anteriorly
Typical peak:
- 4–7 mm laterally
- 1–3 mm anteriorly
2. Anterior cheek stays thin
- Central cheek face kept relatively flat
- Prevents cheek “apple” effect
 Central cheek face kept relatively flat
Design rule:
Anterior malar thickness would rarely exceed lateral thickness.
3. Rapid falloff medially
- Thickness drops quickly toward the nose
- Avoids soft, rounded midface
CAD cue:
- Steep gradient medial to the infraorbital foramen
4. Minimal submalar thickness
- Submalar zone used for support only
- No inferior bulge
Typical:
- 1–2 mm submalar thickness
- Often zero in younger male patients
5. Inferior border taper
- Sharp inferior taper avoids heaviness
- Maintains masculine skeletal definition
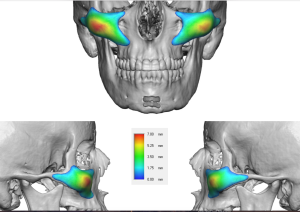
FEMALE Midface Implant – Thickness Map Rules
1. Peak thickness = anterior cheek apex
- Maximum thickness placed anteriorly and inferiorly
- Creates highlight and youthful projection
 Maximum thickness placed anteriorly and inferiorly
Typical peak:
- 4–6 mm anterior malar
- 2–4 mm lateral but not too far back along the arch
2. Smooth radial falloff
- Thickness decreases gradually in all directions
- No abrupt transitions
CAD cue:
- Broad gradient zone rather than sharp edges
3. Submalar blending zone
- Submalar region often intentionally thicker
- Supports lid–cheek junction and nasolabial area
 Submalar region often intentionally thicker
Typical:
- 2–4 mm submalar thickness
- Carefully blended inferiorly
4. Medial feathering
- Implant thins gradually toward nose
- Prevents visible edge or harsh contour
5. Vertical lift bias
- Thickness distribution favors inferior half
- Avoids fullness below oral commissure plane
Side-by-Side Thickness Pattern Summary
|
Feature |
Male |
Female |
|
Thickest zone |
Lateral zygoma |
Anterior malar apex |
|
Anterior cheek |
Thin |
Moderate |
|
Medial falloff |
Steep |
Gradual |
|
Submalar |
Minimal |
Supportive |
|
Edge transitions |
Sharper |
Feathered |
|
Visual effect |
Bone & angles |
Highlight & contour |
Common CAD Design Errors (Both Sexes)
- Uniform thickness ? “implant look”
- Over-thick anterior zone in men ? feminization
- Excess lateral thickness in women ? heavy midface
- Poor inferior taper ? aged appearance
Bottom line
Implant thickness maps are where sex-specific implant design lives.
Two implants with the same volume can look quite different depending on where the millimeters are placed.
Dr. Barry Eppley
World-Renowned Plastic Surgeon