Skeletal augmentation of the infraorbital rim, anterior maxilla, and malar region produces a nonlinear, region-specific soft tissue response. For surgical planning—especially with custom infraorbital–maxillary or “midface mask” implants—quantitative modeling helps answer a practical question:
How many millimeters of surface change (soft tissue forward movement) will occur for each millimeter of bony/implant projection?
A workable, clinically usable framework for projection-to-response ratios (PRRs) has been developed to show how to measure, model, and apply them for predictable midface outcomes. Reference concepts and typical projection ranges are aligned with the underlying implant design principles used by the author in multiple variations of custom midface implants
Definitions
1. Skeletal/Implant Projection (?B)
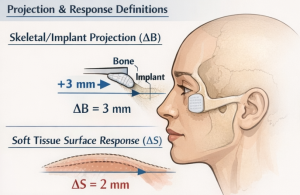 The planned anterior displacement of the bony contour at a defined zone, measured in millimeters:
- Example: infraorbital rim +3 mm, paranasal +5 mm.
2. Soft Tissue Surface Response (?S)
The postoperative anterior movement of the external facial surface at a corresponding landmark/zone, measured in millimeters.
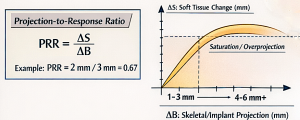 3. Projection-to–Response Ratio (PRR)
PRR =?S/?B
- PRR = 1.0 means 1 mm bone/implant yields 1 mm surface movement.
- PRR < 1.0 means attenuation (common in thicker or tethered tissues).
- PRR > 1.0 may occur locally where soft tissue “unfolds” or is released/tensioned (less common; usually reflects measurement artifacts or concurrent lifts).
Clinical Rationale
Even with identical skeletal projection, two patients can show markedly different external contour change due to:
- skin thickness and elasticity
- subcutaneous and suborbicularis fat volume
- malar fat pad position and ligamentous tethering
- lower eyelid tone
- age-related fibrosis/scarring
- prior filler/fat grafting and associated scarring planes
Therefore, PRR should be treated as a patient- and zone-specific estimates, not a universal constant.
Measurement Protocol
Imaging Inputs
Preoperative
- 3D CT (for bony deficiency mapping and infraorbital foramen position)
- 3D surface scan / photogrammetry (for soft tissue baseline)
Postoperative
- 3D surface scan at:
- Early: 6–8 weeks (still edema-prone)
- Preferred: 3–4 months for most midface implants (after primary contour stabilization)
Registration and Alignment
To avoid spurious PRRs from head position differences:
- Rigid registration to stable cranial regions (forehead/glabella/nasal bridge) for surface scans
- CT-to-surface alignment if both are available (best in research settings)
Landmark and Zone Strategy
PRR is most reliable when measured by zones rather than single points.
Recommended zones (consistent with zonal implant planning):
- Zone 1: infraorbital rim / lid support region
- Zone 2: medial infraorbital / tear trough transition
- Zone 3: paranasal / anterior maxilla
- Zone 4: malar body / zygomatic prominence
- Zone 5: lateral transition feather zone
Measure ?B at the bony surface/implant design and ?S at the corresponding external surface normal to the local contour.
Core Modeling Framework
A. First-Order Linear Model (Clinically Useful)
For each zone z:
?Sz ??z ??Bz
Where: ?z is the zone-specific PRR coefficient (0–1+).
This model is easy to apply in surgical planning software and is appropriate for modest projections (typical infraorbital 2–3 mm, maxilla 4–6 mm).
B. Enhanced Multivariable Model (Better Fit)
?Sz ??z ??Bz +?1z (T)+?2z (L)+?3z (A)+?
Where predictors may include:
- T: skin/soft tissue thickness (mm)
- L: ligamentous tethering score (ordinal; based on exam and imaging)
- A: age or tissue compliance proxy?: noise + edema + measurement error
In practice, the most powerful single modifier is local thickness/compliance.
C. Saturation / Nonlinearity (Overprojection Penalty)
Once projection exceeds tissue accommodation, additional ?B produces less ?S and more “unnatural fullness.” A simple saturating form:
?Sz ?1+kz ?Bz ?z ?Bz
This mirrors the clinical observation that aggressive infraorbital projection risks the “shelf effect”.
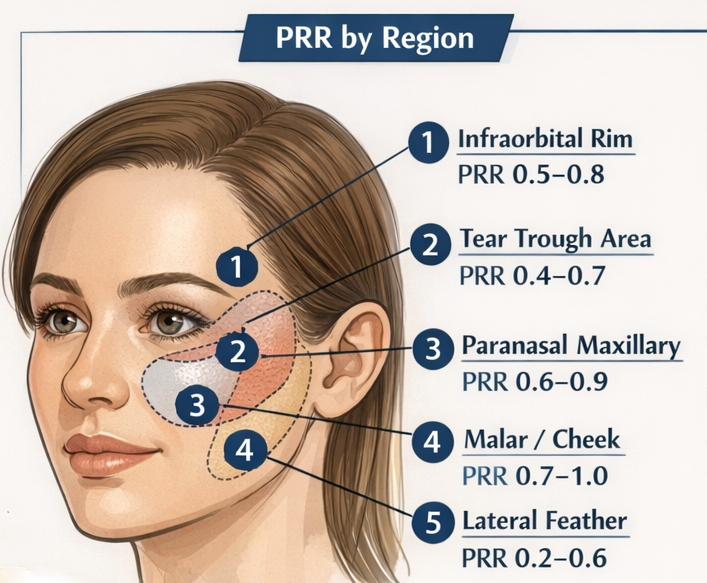
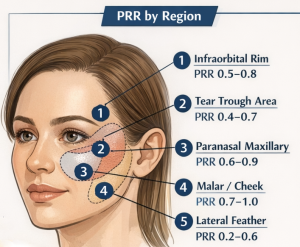
Practical PRR Ranges by Zone
These are planning heuristics (not fixed truths). They help anticipate where skeletal change “shows” most and where it attenuates.
Zone 1: Infraorbital Rim (Lower Lid Support)
- Typical PRR: 0.5–0.8
- Why: tight soft tissue envelope, orbicularis influence, risk of stiffness/visibility with overprojection
Zone 2: Medial Infraorbital / Tear Trough Transition
- Typical PRR: 0.4–0.7
- Why: thin skin + complex contour; small skeletal changes can improve light reflection if transitions are smooth
Zone 3: Paranasal / Anterior Maxilla
- Typical PRR: 0.6–0.9
- Why: often responds well because augmentation restores a concavity that strongly affects profile and nasolabial support
Zone 4: Malar Body (Zygomatic Prominence)
- Typical PRR: 0.7–1.0
- Why: thicker soft tissues and broader drape can translate skeletal contour more directly (especially in younger patients)
Zone 5: Lateral Feather Zones
- Typical PRR: 0.2–0.6
- Why: by design these are transitional; they should “disappear” into native anatomy
These ranges integrate the same zonal design logic and transition emphasis described in the author’s implant design principles.
Patient-Specific Modifiers
1. Soft Tissue Thickness (T)
A simple, clinically practical adjustment is:
- Thicker tissues ? lower visible response (PRR?)
- Thin tissues?visibility and edge risk (PRR may appear ? but tolerance ?)
Suggested qualitative adjustment:
- Thin skin: reduce planned ?B and extend feathering (not because PRR is “better,” but because visibility risk is higher).
- Thick skin: may require slightly more ?B for equivalent surface effect, but tolerates transitions better.
2. Lower Eyelid Tone and Vector
If lid tone is poor, the same projection may not yield proportional improvement in lid-cheek junction aesthetics. In those patients, the model must include a “support utilization” factor:
?Sapparent =?S?u(0<u?1)
Where u decreases with significant laxity unless lid tightening is performed.
3. Prior Fat/Filler and Scar Planes
Prior augmentation can introduce fibrosis that:
- reduces ?S for given ?B (PRR ?)
- increases contour irregularity risk unless edges are aggressively feathered
 Applying PRR to Implant Design
Step 1: Set Aesthetic Target by Zone
Define target external surface change, not just implant thickness:
- desired reduction in tear trough shadow
- improved lid-cheek transition convexity
- improved paranasal support on profile
Step 2: Convert Target ?S to Planned?B
?Bz ?PRRz ?Sz
Step 3: Enforce Transition Constraints
Regardless of ?B, all borders must taper to 0 mm and avoid focal infraorbital “shelf” geometry.
Step 4: Add Safety Rules
- If planned infraorbital ?B > ~3–4 mm, require extended blending and reassess eyelid stiffness risk (clinical “nonlinearity zone”).
- If paranasal ?B > ~6 mm, ensure the augmentation remains skeletal-harmony restoring rather than “filled” in appearance.
Model Validation and Common Sources of Error
Edema and Timing
Swelling can falsely elevate ?S early. For quantitative assessment, avoid using scans earlier than ~8–12 weeks; best at ~3–4 months.
Registration Error
Small misalignment creates large apparent ?S in the infraorbital region. Always rigid-register to stable cranial reference surfaces.
Landmark Drift
Single-point landmarks shift with expression and lid position. Prefer zone-based surface normal displacement maps.
Clinical Takeaways
- PRR is zone-dependent; infraorbital response is generally more attenuated and less tolerant of overprojection than malar/paranasal regions.
- Use PRR to plan surface goals, then back-calculate implant thickness per zone.
- Expect nonlinearity at higher projections—additional millimeters increasingly risk unnatural contour rather than proportional benefit.
- Soft tissue thickness, eyelid tone, and prior augmentation history are the strongest real-world modifiers.
Dr. Barry Eppley
Plastic Surgeon